Every town on the lake prices and taxes differently. Brookfield's mill rate is 28.93 for the fiscal year ending 2026, and a revaluation is underway now. See how the five towns actually compare, then read the guides:
See homes for sale near Candlewood Lake, browse recent sales, or find out what your Brookfield home is worth.
Brookfield's mill rate is 28.93 for the fiscal year ending 2026, according to the Connecticut Office of Policy and Management. Connecticut assesses property at 70 percent of market value, so a home assessed at $400,000, which implies roughly $571,000 of market value, works out to about $11,572 a year at that rate. That is the arithmetic, but the rate on its own is not the answer. Your bill is the assessment multiplied by the mill rate, and a town with a low rate and high assessments can bill more than a town with a high rate and low assessments. Before comparing Brookfield to a neighboring town, pull the actual assessment on the actual house and do the multiplication yourself. The Candlewood Shores Tax District adds 3.7435 mills on the same assessment, a figure that has not moved in four fiscal years; it and Brookfield's other districts are listed with five years of rates in the second mill rate: every Candlewood Lake tax district on the state's fiscal 2026 list.
Yes. Brookfield is running a town wide revaluation for the Grand List of October 1, 2026, with Tyler Technologies contracted to do the field work. Field inspections began on June 18, 2026, starting at Candlewood Lake Shores and the surrounding area, and properties that sold between October 1, 2024 and October 1, 2026 get priority attention. New assessments reach tax bills in July 2027, and the mill rate that applies to them is not adopted until roughly late April or May of 2027. That timing matters: multiplying a new assessment by the current 28.93 rate produces a number that cannot be right yet. A revaluation redistributes an existing tax burden rather than raising one, so what decides your bill is whether your property moved more or less than the town average.
The town's February 2026 revaluation background document gives the calendar: notices of new assessments mailed in November 2026, informal hearings with Tyler Technologies from November 2026, a second notice in January 2027 for any value that changes, Board of Assessment Appeals filings due by February 20, 2027 with hearings in March, and the first tax bills on the new values due beginning July 2027. When your Candlewood town revalues next carries the document.
For the fiscal year ending 2026 the published rates are Sherman 16.67, Danbury 24.99, New Fairfield 26.33, Brookfield 28.93 and New Milford 30.96. Read as a ranking of what you will pay, that list is misleading, because each rate is set against that town's own assessments and each town sits at a different point in its revaluation cycle. A town that revalued recently shows a lower rate against current values; a town several years out shows a higher rate against older values. On lake property the gap widens further, because waterfront values have not moved in step with inland values, so an assessment set in an older market can be well behind what a Brookfield waterfront home would sell for today.
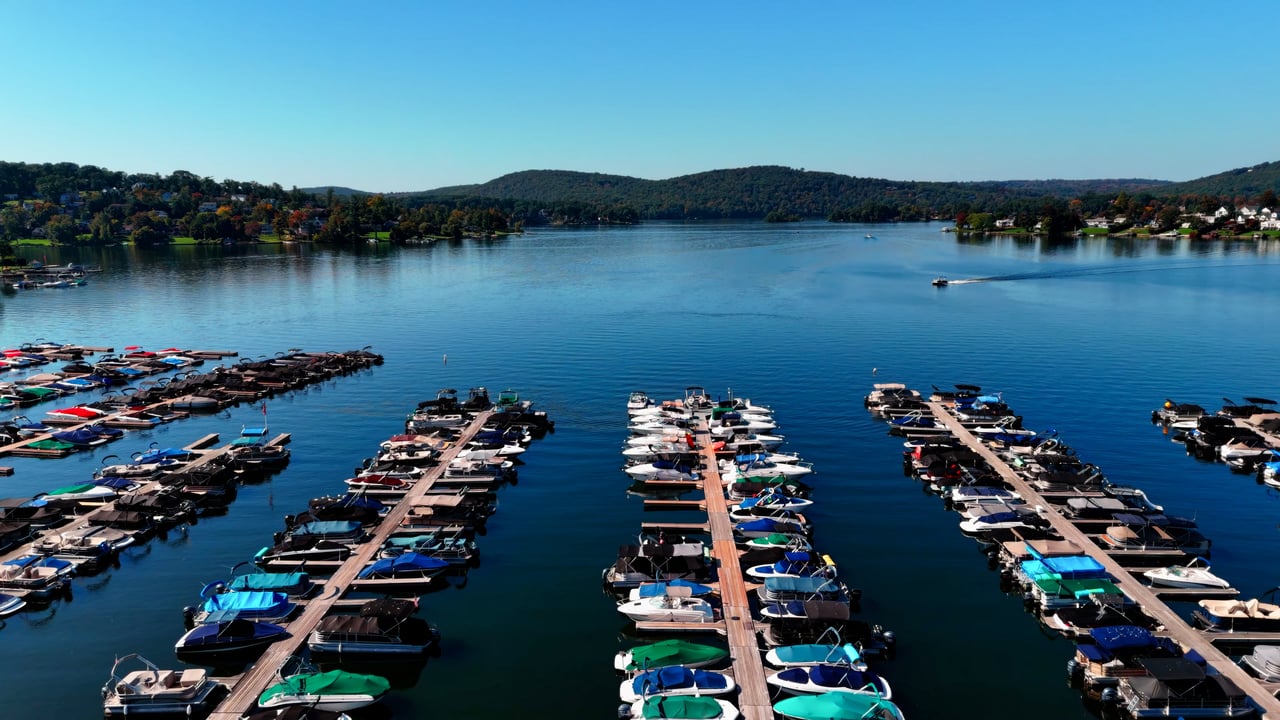
Not automatically, and not by inheriting the seller’s. FirstLight issues Candlewood dock permits to the owner rather than to the property, so a new owner applies for their own. A dock in the listing photographs is not a dock that conveys. Establish before you offer what structure exists, what is actually authorized, and what the path to your own permit looks like.
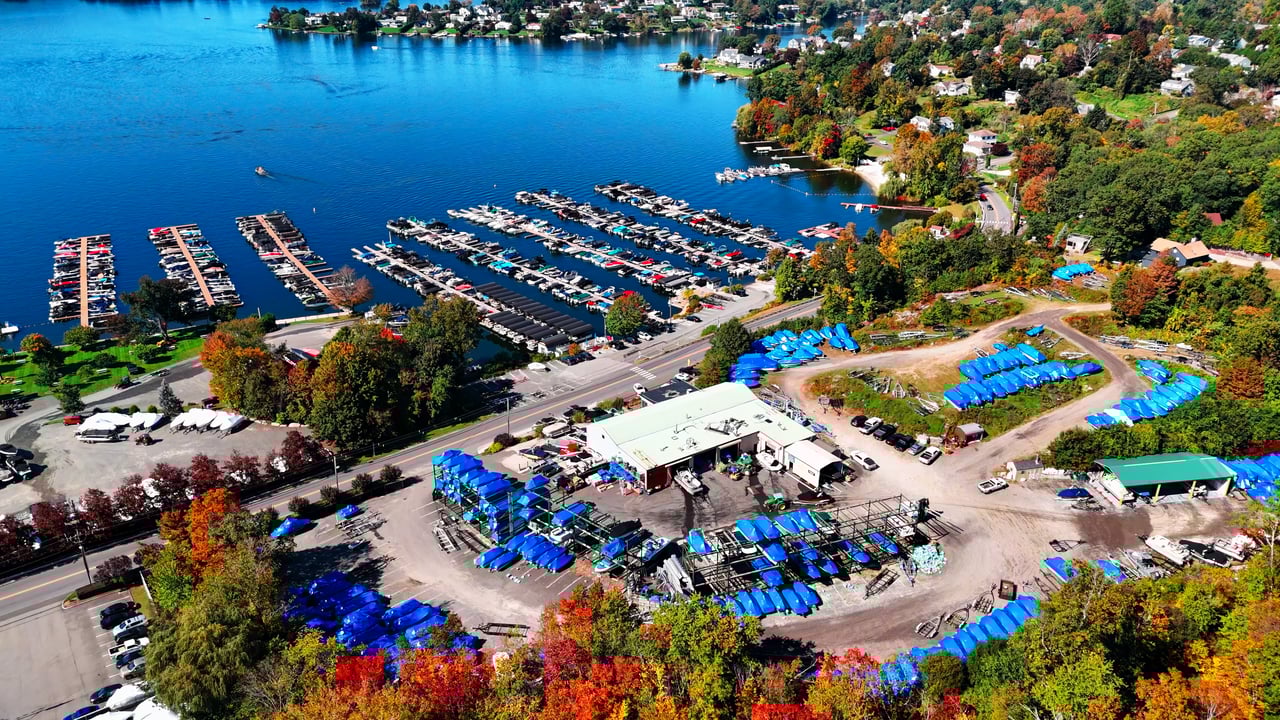
Brookfield Bay shows up by name in the lake's records. In FirstLight's March 2025 filing to federal regulators, the state fisheries biologist described the back of Brookfield Bay as a four acre zone where cold water aggregates the sterile grass carp, and said the state got 133 out of that zone in one event as it works to let the lake's plants return. The Candlewood Lake Authority's 2025 Lake Steward report counted 46 boater stops at the Brookfield town ramp, and its 2025 water quality report sampled the late fall 2025 bloom at a Brookfield point. Where Candlewood's weeds went, and when they come back, who launches on Candlewood Lake and Candlewood Lake water quality in 2025 read those documents for a buyer.
Yes, with a zoning permit, and Brookfield is stricter than most people expect. Section 3.19 of the town’s zoning regulations allows short term rental of dwelling units as an accessory use in residential districts by Zoning Permit, with standards amended effective June 12, 2026. Those standards cap occupancy at two guests per bedroom and six people total for the rental period, not counting children under 12, and require the unit be leased to at least one adult who actually occupies it. Brookfield also limits how often a property may be rented this way. Read the current regulations before you build rental income into your numbers.
You are not required to have one, which is exactly why it matters. Connecticut does not license or certify septic inspectors, so there is no state credential to check and no mandated procedure. Most of the shoreline is on private septic, and the number that matters is the bedroom count the system was designed for, which should be on file with the town health department. If the house sleeps more people today than the system was sized for, that gap becomes yours at closing.
Your purchase price does not become your assessed value. Connecticut assesses at seventy per cent of true and actual value as of the town’s revaluation date, not as of your closing. Brookfield is going through a 2026 revaluation, so owners here should understand what that changes and what it does not before reading anything into the mill rate.
Brookfield waterfront carries a set of questions that do not come up on an inland house, and most of them are cheaper to answer before you are under contract than after.
17,871 people live in Brookfield, where the median age is 45.8 and the average individual income is $66,302. Data provided by the U.S. Census Bureau.
Total Population
Median Age
Population Density Population Density This is the number of people per square mile in a neighborhood.
Average individual Income
There's plenty to do around Brookfield, including shopping, dining, nightlife, parks, and more. Data provided by Walk Score and Yelp.
Explore popular things to do in the area, including Barbara’s Delights, Ms. P's Kitchen, and Divine CakesArt.
| Name | Category | Distance | Reviews |
Ratings by
Yelp
|
|---|---|---|---|---|
| Dining | 0.25 miles | 0 reviews | 0/5 stars | |
| Dining | 0.25 miles | 0 reviews | 0/5 stars | |
| Dining | 0.4 miles | 0 reviews | 0/5 stars | |
| Dining | 0.64 miles | 0 reviews | 0/5 stars | |
| Dining · $$ | 0.84 miles | 61 reviews | 4.1/5 stars | |
| Dining | 0.89 miles | 11 reviews | 4.6/5 stars | |
| Dining | 0.93 miles | 4 reviews | 3.3/5 stars | |
| Dining · $$ | 0.95 miles | 139 reviews | 3.7/5 stars | |
| Dining | 0.95 miles | 0 reviews | 0/5 stars | |
| Dining | 0.95 miles | 0 reviews | 0/5 stars | |
| Shopping | 0.84 miles | 0 reviews | 0/5 stars | |
| Active | 0.24 miles | 1 review | 4/5 stars | |
| Active | 0.25 miles | 0 reviews | 0/5 stars | |
| Active | 0.25 miles | 0 reviews | 0/5 stars | |
| Active | 0.25 miles | 0 reviews | 0/5 stars | |
| Active | 0.83 miles | 0 reviews | 0/5 stars | |
| Active | 0.85 miles | 0 reviews | 0/5 stars | |
| Active | 0.87 miles | 58 reviews | 1.5/5 stars | |
| Active | 0.93 miles | 1 review | 5/5 stars | |
| Nightlife | 0.83 miles | 0 reviews | 0/5 stars | |
| Beauty | 0.25 miles | 0 reviews | 0/5 stars | |
| Beauty | 0.83 miles | 1 review | 5/5 stars | |
| Beauty | 0.87 miles | 17 reviews | 4.6/5 stars | |
| Beauty | 0.94 miles | 0 reviews | 0/5 stars | |
|
|
||||
|
|
||||
|
|
||||
|
|
||||
|
|
||||
|
|
Brookfield has 6,644 households, with an average household size of 2.68. Data provided by the U.S. Census Bureau. Here’s what the people living in Brookfield do for work — and how long it takes them to get there. Data provided by the U.S. Census Bureau. 17,871 people call Brookfield home. The population density is 895 and the largest age group is Data provided by the U.S. Census Bureau.
Total Population
Population Density Population Density This is the number of people per square mile in a neighborhood.
Median Age
Men vs Women
Population by Age Group
0-9 Years
10-17 Years
18-24 Years
25-64 Years
65-74 Years
75+ Years
Education Level
Total Households
Average Household Size
Average individual Income
Households with Children
With Children:
Without Children:
Marital Status
Blue vs White Collar Workers
Blue Collar:
White Collar: